Zap the cockroaches by figuring out the equations of their straight paths! The goal is to keep moving up to the next level!!
If you have extra time, you can practice guessing the rule of linear functions.
Slope
Below is a graph that matches the equation shown.
Slope slider
Play around with adjusting the numbers and figure out how they effect the graph.
#1. When you change the number multiplied by x, how does that effect the graph?
What happens when it is negative?
What does the graph look like when it is zero?
#2. When you change the number added at the end of the equation, how does that effect the graph?
What happens when it is negative?
What does the graph look like when it is zero?
Walking Rates
Everyone open your book to page 18 and read the directions.
Instead of doing 2.2 A on your paper, you are going to complete the tables on the computer.
Open the folder on the desktop labeled "Walking Rates"
Find your period, and the spreadsheet for you (ex: if you are in period 6 and in the "first rotation" at the computer station.... you'd be Per6 rotation 1 Walking Rates.xls)
Walking Rates
Terry walks 1 meter per second.
Jade walks 2 meters per second.
Jerome walks 2.5 meters per second.
Complete the tables by typing in the data based off each person's walking rate.
Answer questions on page 18:
A) How does the walking rate affect the data in the table?
B) How does the walking rate affect the graphs?
C) For each student, write an equation that gives the relationship between the time and the distance walked. Let d represent the distance in meters and t represent the time in seconds.
When you are finished, do the problems on page 17.
Raise Your Grade!
I’m offering free tutoring sessions every Monday, Tuesday, Thursday, and Friday from 2:05-3pm in my classroom after school.
Please find the “Tracking” by period to find out which skills you don’t have an "X" by.... that is a skill you need more practice on!
Math is a yearlong course, so grades are ongoing. Even if you currently have an F, you can still pass the year if you show me that you can do the math! Even if you currently have a D, you can still bring it up to an A if you learn the math. Unlimited retakes means IT’S NEVER TOO LATE!
TUTORING- I am offering tutoring sessions for each specific skill for one hour after school. At the end of the hour, you should be able to master this skill, and I will offer you a chance to retake the quiz. Don't make excuses, make it happen!
Tutoring: 2:05-3pm in Room E104
Thursday 2/12: I Can #18
Friday 2/13: I Can #17
Tuesday 2/17: I Can #16
Thursday 2/19: I Can #15
Friday 2/20: I Can #14
Monday 2/23: I Can #13
Tuesday 2/24: I Can #12
Thursday 2/26: I Can #10
Friday 2/27: I Can #9
Monday 3/2: I Can #8
Tuesday 3/3: I Can #7
Thursday 3/5: I Can #6
Friday 3/6: I Can #5 + I Can #4
Monday 3/9: I Can #3
Tuesday 3/10: I Can #2 + I Can #1
Global Warming: Real graphs, that tell real stories.
Here are some graphs on related global warming issues. (Click for some info on global warming if you are unsure what that is).
YOUR TASK:
Examine the related graphs below:
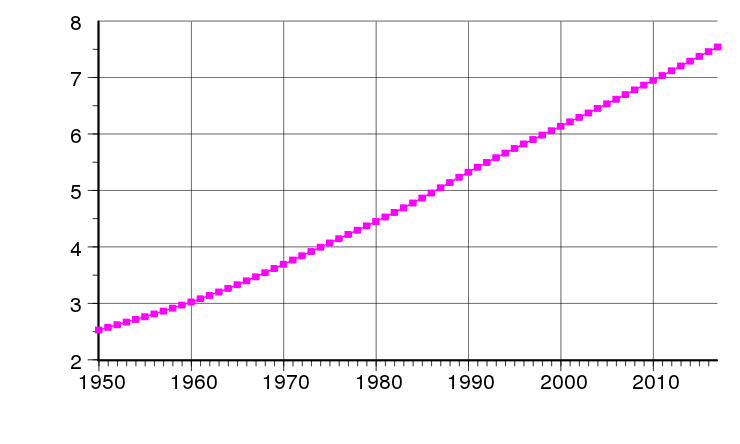
World Population
Carbon Dioxide
Global Temperature
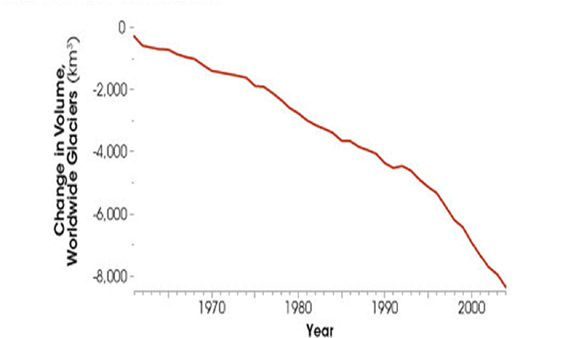
Glaciers
Sea Level
For each graph write at least two sentences that describe the relationship between the variables on the graph.
Ex: "__(y)__depends on___(x)___. As __(x)____increases, the __(more/less)____ __(y)____".
Concluding thoughts: Start at the top of the list and think about how the trend in one issue effects the next issue. Then look at the issue below that and describe how it is effected.....go straight down the list until the last issue "sea level".
Ex: World population is increasing, and more people produce more carbon dioxide.
If you have time.... type up your sentences in Word, copy and paste the graphs into your answer, then print it out!
YOUR TASK:
Examine the related graphs below:
World Population
Carbon Dioxide
Global Temperature
Glaciers
Sea Level
For each graph write at least two sentences that describe the relationship between the variables on the graph.
Ex: "__(y)__depends on___(x)___. As __(x)____increases, the __(more/less)____ __(y)____".
Concluding thoughts: Start at the top of the list and think about how the trend in one issue effects the next issue. Then look at the issue below that and describe how it is effected.....go straight down the list until the last issue "sea level".
Ex: World population is increasing, and more people produce more carbon dioxide.
If you have time.... type up your sentences in Word, copy and paste the graphs into your answer, then print it out!
Subscribe to:
Comments (Atom)