Here are some graphs on related global warming issues. (Click for some info on global warming if you are unsure what that is).
YOUR TASK:
Examine the related graphs below:
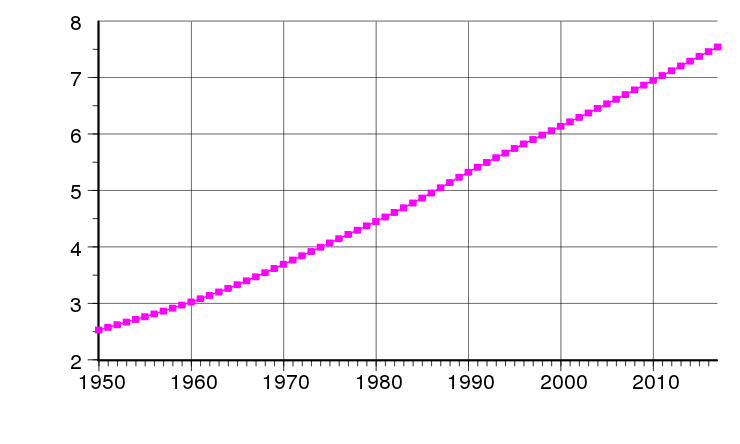
World Population
Carbon Dioxide
Global Temperature
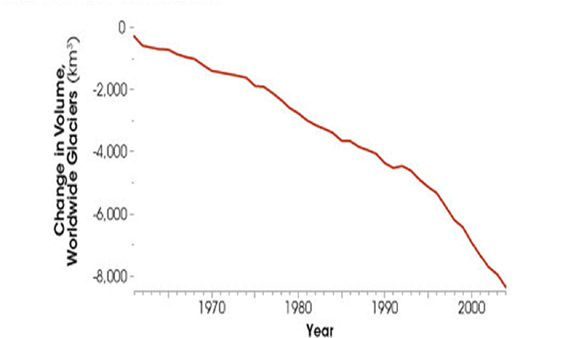
Glaciers
Sea Level
For each graph write at least two sentences that describe the relationship between the variables on the graph.
Ex: "__(y)__depends on___(x)___. As __(x)____increases, the __(more/less)____ __(y)____".
Concluding thoughts: Start at the top of the list and think about how the trend in one issue effects the next issue. Then look at the issue below that and describe how it is effected.....go straight down the list until the last issue "sea level".
Ex: World population is increasing, and more people produce more carbon dioxide.
If you have time.... type up your sentences in Word, copy and paste the graphs into your answer, then print it out!
Subscribe to:
Post Comments (Atom)
No comments:
Post a Comment